
Thinking /
Thinking
-
-
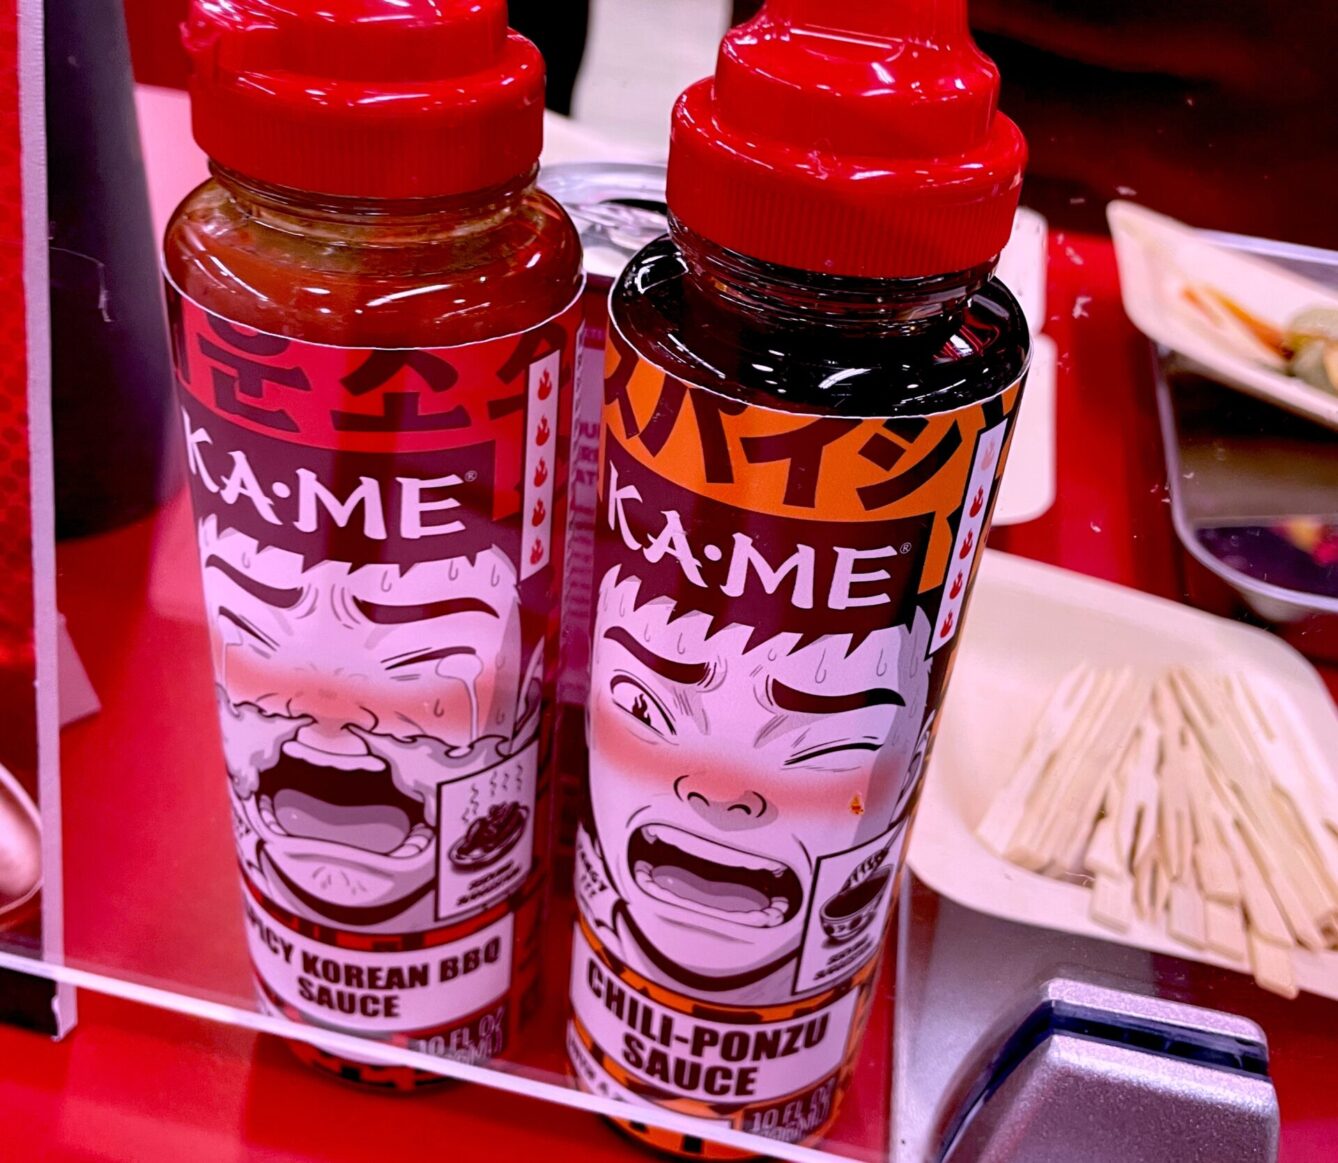
Expo West Is the Coachella of Natural Products
-

Stop Guessing. Start Driving Volume.
-

The Next Phase of Retail Media: Five Shifts Defining 2026
-
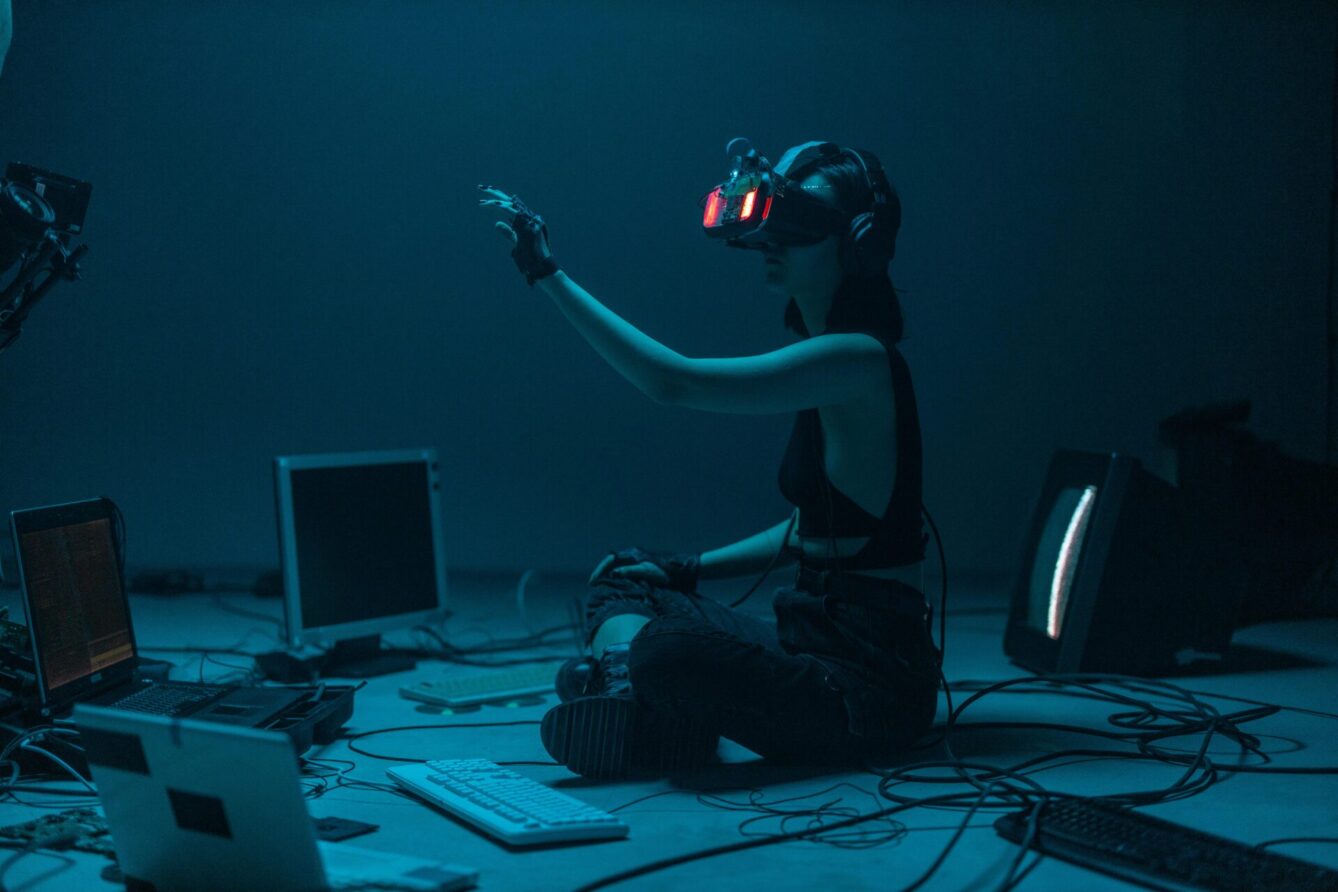
CES 2026: Moving from the “What If?” of AI to the “What’s Next?”
-

Is Your Brand Ready for the Algorithmic Imperative?
-
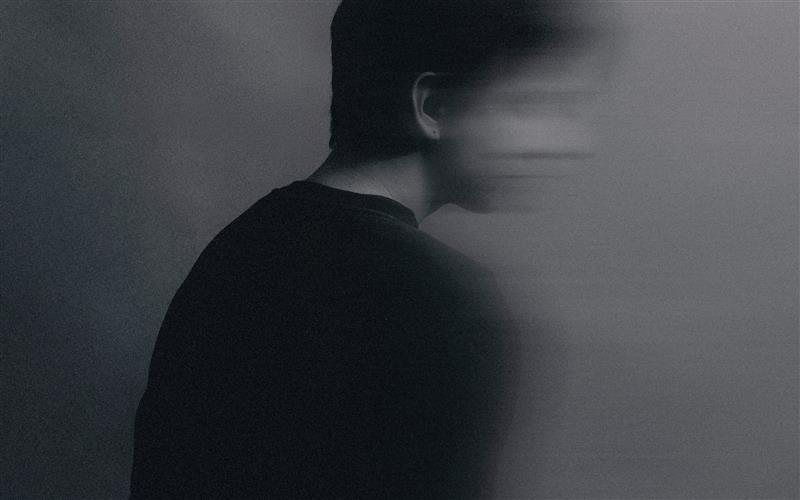
The Future of Retail: Why the Human Is Still King in an AI World
-

The Nudge Behind the Gift: How Behavioral Science (and Santa) Can Help Marketers Win the Holidays